Fig. (2)
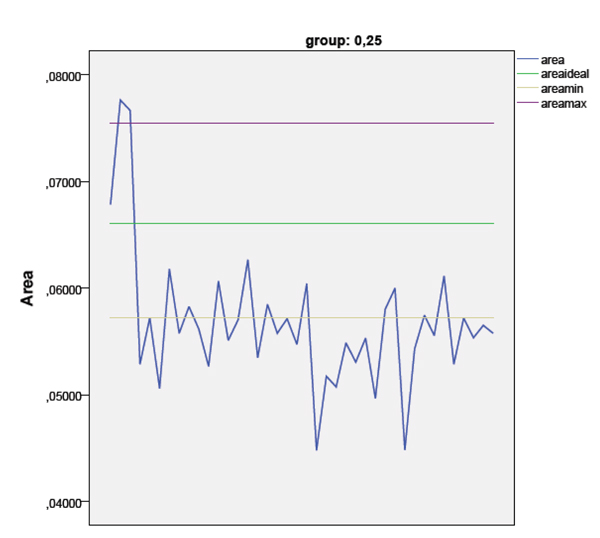
Graphic 1 - The blue line shows the Area values distribution in group 1. The green line shows the ideal area value, while purple and yellow line define the acceptable tolerance of metal (2%).