Fig. (4)
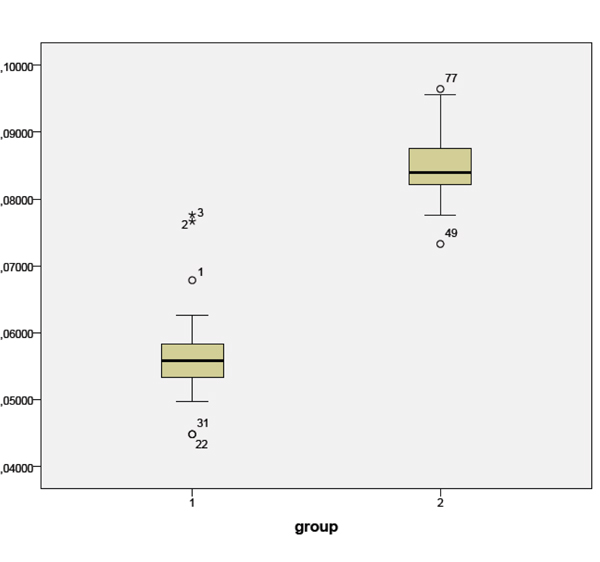
Graphic 3 – the box-and-whisker plot shows the distribution of area values in both 0.25 and 0.30 group. Whiskers represent 1.5 I QR while outliers are shown as circles and stars.