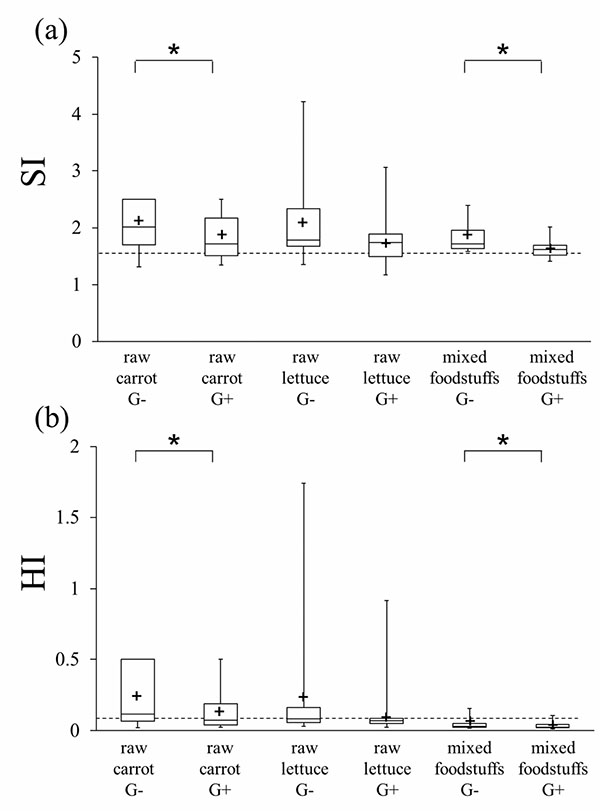
Fig. (4)
Box-and-whisker plot for HI and SI values for 20 masticatory strokes of all the subjects.
The dotted lines show the thresholds for the range of normal mastication for HI (0.10) and SI (1.62) reported by Sugimoto et al. [13]. SI and HI values for raw carrot and mixed foodstuffs with G+ were significantly lower than those with G- (p<.05). +, mean value.