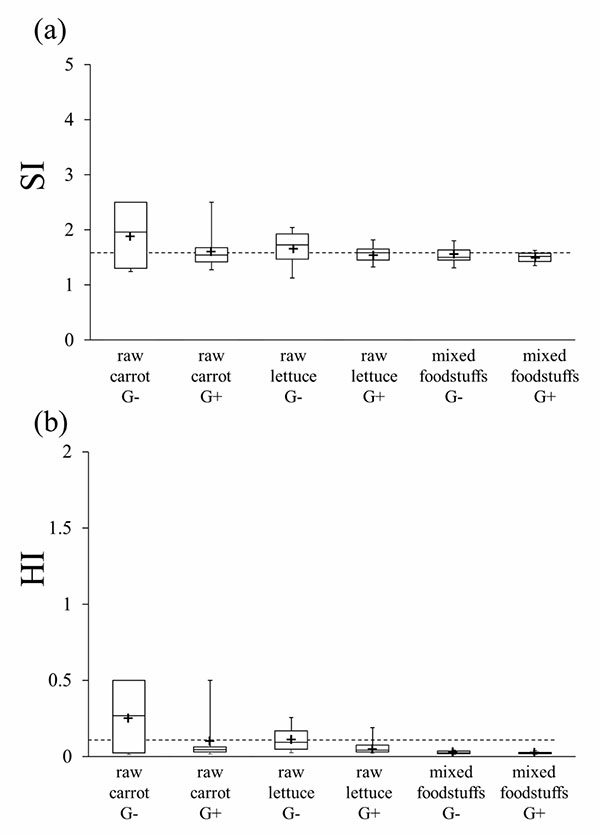
Fig. (5)
Box-and-whisker plot for HI and SI values of all the subjects just before swallowing.
The dotted lines show the thresholds for the range of normal mastication for HI (0.10) and SI (1.62) reported by Sugimoto et al. [13]. Note that the median value for G+ for all the experimental food condition are lower than the threshold. +, mean value.