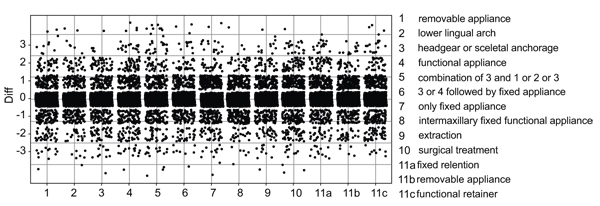
Fig. (2)
Graphical overview. Every single point illustrates the discrepancy of answers of each orthodontist to each question (T2-T1). For example: The answer for question 1 at T1 was definitely yes equal to 1, but at T2 it was definitely no, which corresponds to 5 – from this it follows that the discrepancy is 4 (T2-T1), which is marked as a single point at the y-axis.