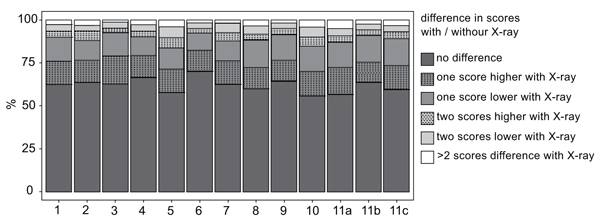
Fig. (3)
Difference in scores with / without X-ray. All examined questions are listed in the x-axis from 1 to 11c. The y-axis represents the percentage of differences in answering each question. It is visible that over 50% of answers did not differ at T1 and T2.