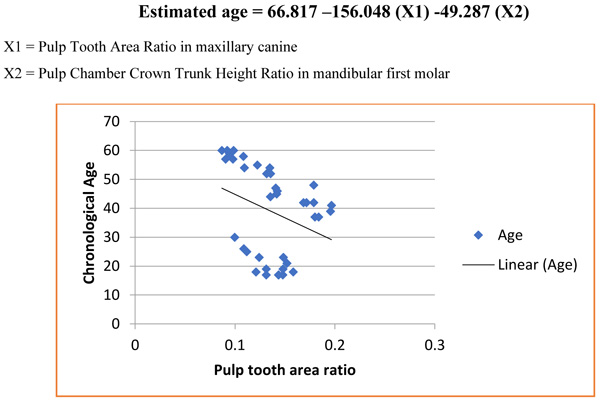
Graph 1
Scatter plot distribution of the pulp tooth ratio in maxillary canine when compared to the subject’s chronological age.