Fig. (1)
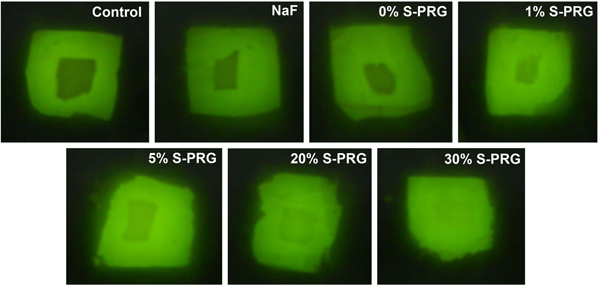
Representative QLF images from the experimental groups. (
A
) untreated, (
B
) 1100 ppm NaF, (
C
) 0 wt% S-PRG, (
D
) 1 wt% S-PRG, (
E
) 5 wt% S-PRG, (
F
) 20 wt% S-PRG, (
G
) 30 wt% S-PRG.