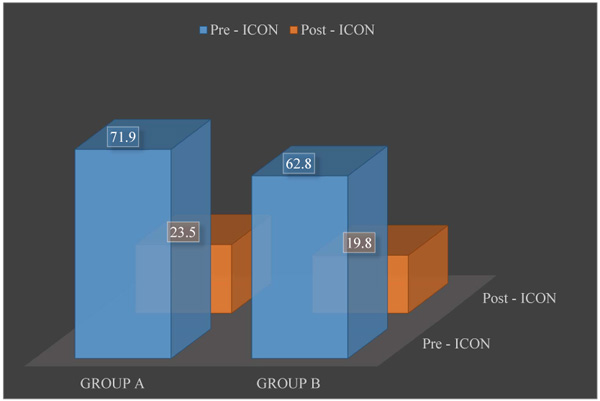
Fig. (2)
Mean pre-treatment and post- treatment ICON scores for groups A and B, respectively.