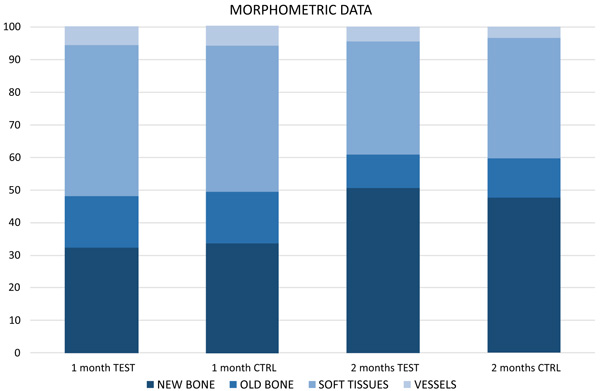
Fig. (2)
Graph illustrating histomorphometric evaluation of tissues components in percentage (%) after 1 and two months of healing at untreated (CTRL, control) and treated (TEST) sites. n=8.