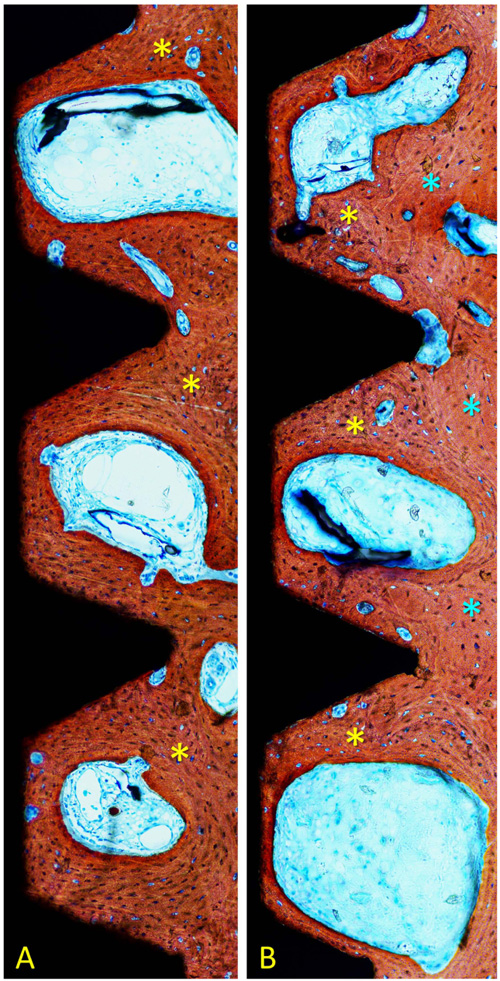
Fig. (3)
Microphotographs of ground sections representing the healing after 2 months at (A) untreated and treated (B) implant surfaces. Lower amounts of old bone (light blue stars) are still visible while new bone (yellow stars) is represented by higher percentages compared the previous period of healing.