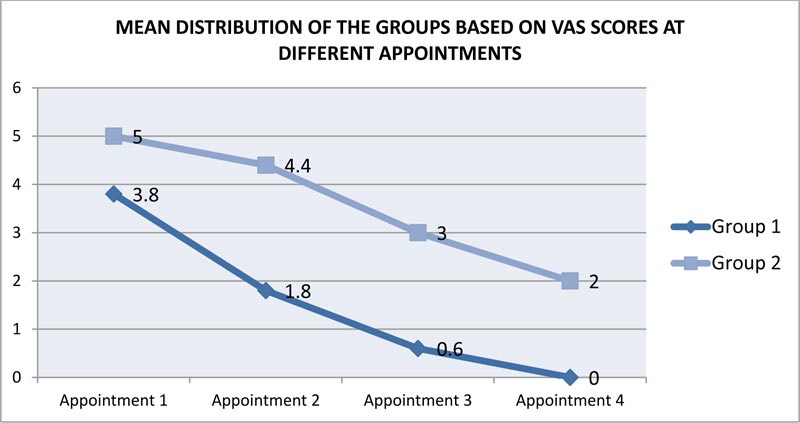
Fig. (1)
Mean distribution of the groups based on vas scores at different appointments.