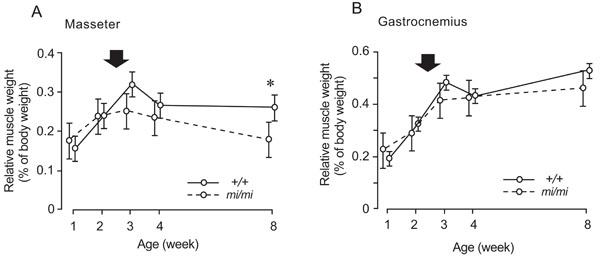
Fig. (3) Changes in the percentage of masseter (A) and gastrocnemius (B) weight relative to body weight at 1, 2, 3, 4, and 8 weeks of age in the mi/mi (dotted line) and +/+ (solid line) mice. Each point and its vertical bar represent the mean ± S.D. of six samples. Significant difference between mi/mi and +/+, *p<0.05. Arrows indicate the period of weaning.