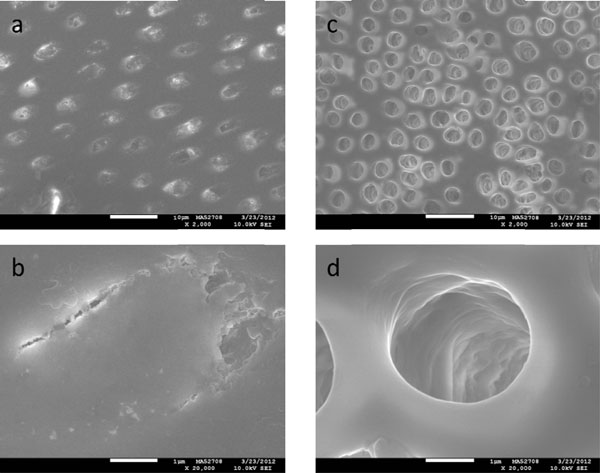
Fig. (2)
SEM images of sound (a, b) and demineralized (
c
,
d
) bovine dentin at 2,000x and 20,000x. The white scale bars in the top and bottom rows correspond to 10 (
a
,
c
) and 1 (
b
,
d
) µm, respectively.