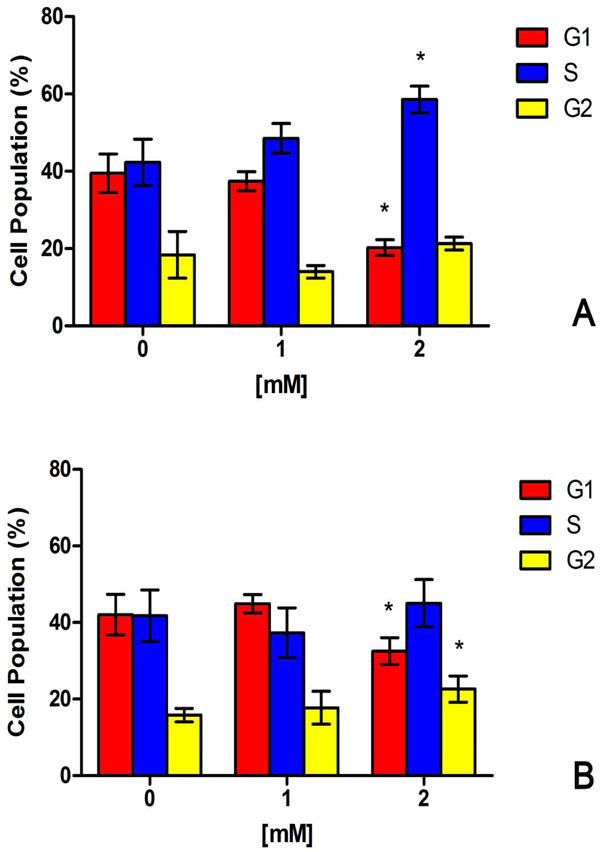
Fig. (3) Cell cycle analyses. The distribution of U2OS (A) and
HaCat (B) cells between the three phases of the cell cycle (G1, S
and G2) is presented after exposure to 1mM and 2mM NiCl2 for
24h. The percentages of cell numbers in each phase were calculated
from individual histograms in at least five independent experiments
(n = 5). * (p<0.05) indicates significant differences between cell
culture treated with NiCl2 and untreated controls.