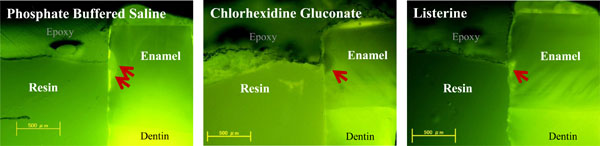
Fig. (5a) Photomicrographs represent a typical sized lesion from each experimental group taken by fluorescence microscopy. Demineralized regions are indicated by red arrows. Lesion size was largest in the phosphate-buffered saline control group and was smallest in Listerine group. The chlorhexidine gluconate group displayed larger lesions than the Listerine group. (‘Epoxy’ indicates the polymer resin used for embedding the samples).