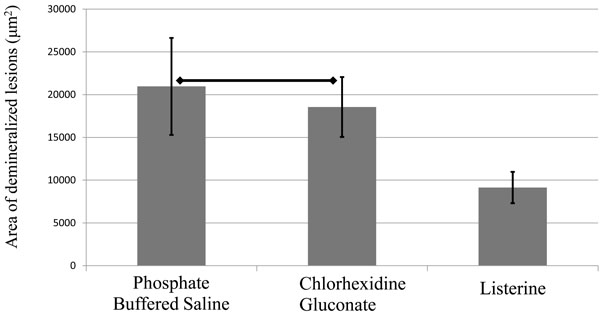
Fig. (5b)
Graph represents the average size of the lesion in each group. Horizontal lines indicate statistically no significant differences as analyzed by one-way analysis of variance and Tukey’s honestly significant difference test (P>0.05, n=7).