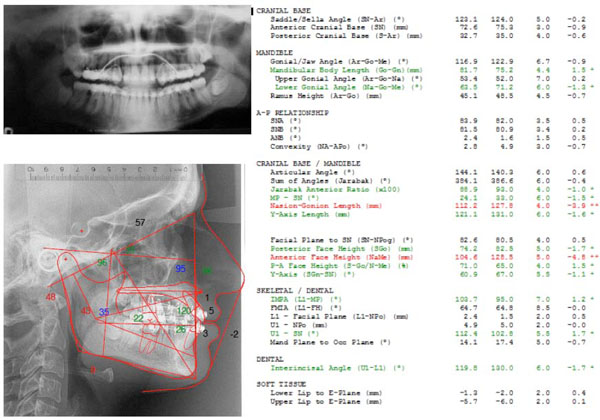
Fig. (8) Cephalmetric values and panoramic radiograph just before the end of treatment, before final debonding. From left to right: value measured, average value from the population norm, standard deviation of the average value from the population norm, difference from the extreme value of the population norm. Red: values above the norm, Green: values below the norm, Black: values within the norm