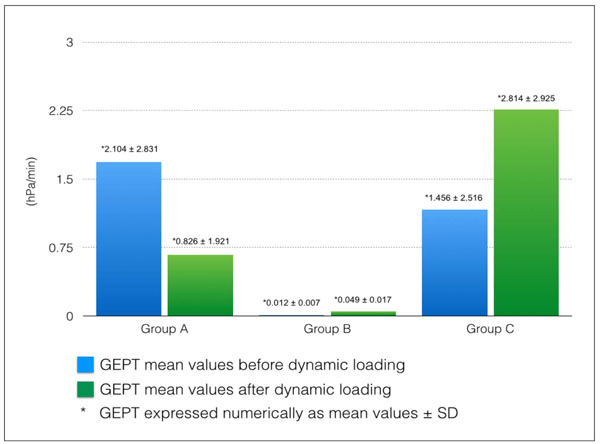
Fig. (4)
A graph showing a comparison of implants performance before and after dynamic loading presented as mean values ± SD.