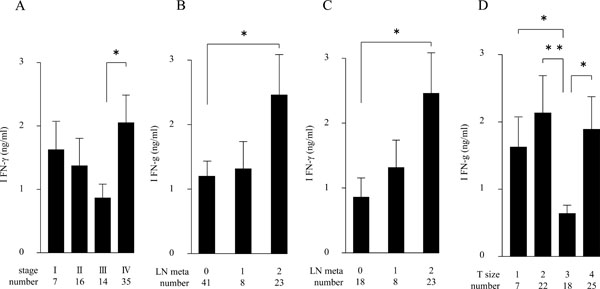
Fig. (1) LPS-induced IFN-γ production in PB from 72 OSCC patients (A, B, D), or from the 49 patients in stages III and IV (C). Amounts of IFN-γ (ng/ml) are in ordinate, and samples classified with corresponding tumor stages (A), lymphnode metastases (B, C) and tumor sizes (D) are denoted in abscissa, respectively. (*p < 0.05, ** p < 0.01). Error bar shows SD.