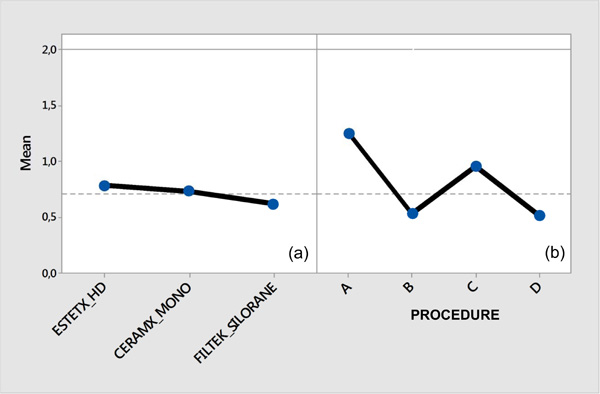
Fig. (6) Main effects plot reporting the values of roughness averaged over the factors (i) materials and (ii) procedure. The horizontal line reported in the two diagrams represents the average roughness value measured in all the experiments conducted. For example, the value of roughness reported in the diagram (a) for the material CERAMX MONO, represents the average roughness value measured on all the samples made of this material. Similarly, the roughness value reported in the diagram (b) for the procedure B represents the value of roughness averaged over all the measurements carried out on samples treated with this procedure.