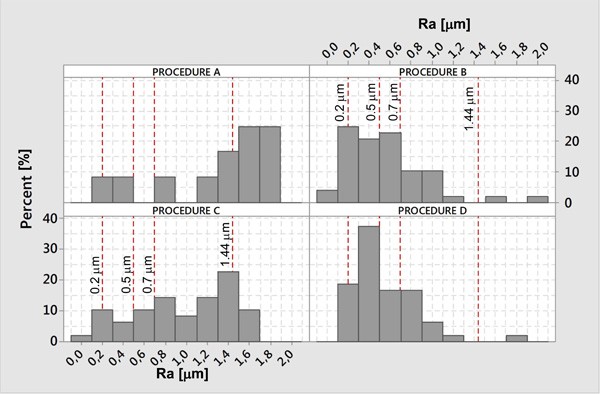
Fig. (8) Histograms showing, for each procedure investigated, the percentage of samples the roughness of which falls within given intervals. For example, with reference to procedure A, about 8 % of samples presents a roughness within the interval 0.1 - 0.3 mm; similarly, with reference to procedure D, about 37 % of the samples present a roughness that falls within the interval 0.3 - 0.5 mm. The dashed red lines represent threshold roughness values reported in the literature above which a simultaneous increase in the plaque and in the risk of caries and periodontal inflammation is associated.