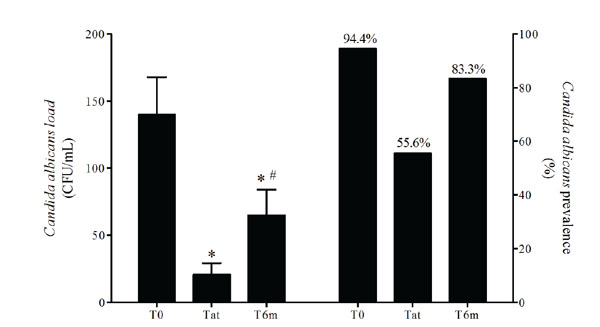
Fig. (2) Oral Candida albicans load and prevalence at the time of stomatitis diagnosis (T0), after treatment (Tat) and 6-months after diagnosis
(T6m). Left bars represent means and error bars represent SD. p values were calculated using Anova (p=0.00038) followed by students’ ttest.
*p<0.05, significantly different from T0; #p<0.05, significantly different from Tat. Right bars represent prevalence.