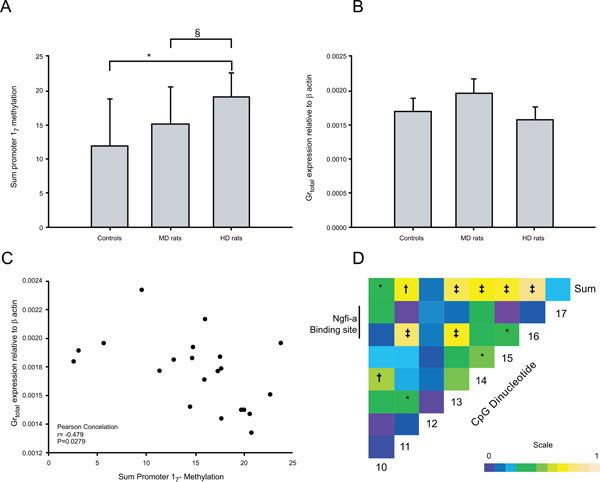
Fig. (5) Sum methylation levels throughout the Gr 17 promoter (A), the relative expression of total Gr levels (B) and the correlation of promoter
17 sum methylation and total Gr transcript levels (C) in the hippocampus after exposure to control, handling (HD) or maternal deprivation
(MD) conditions. (D) Pearson correlation heatmap for individual CpGs in the hippocampus and the sum methylation level throughout
the Gr 17 promoter. Pearson correlation coefficients are expressed by colour (0 (blue) to 1 (yellow)) as per scale. § p=0.06, * p < 0.05, †
p<0.01, ‡ p<0.001. Panels A and B are mean +/-SD.