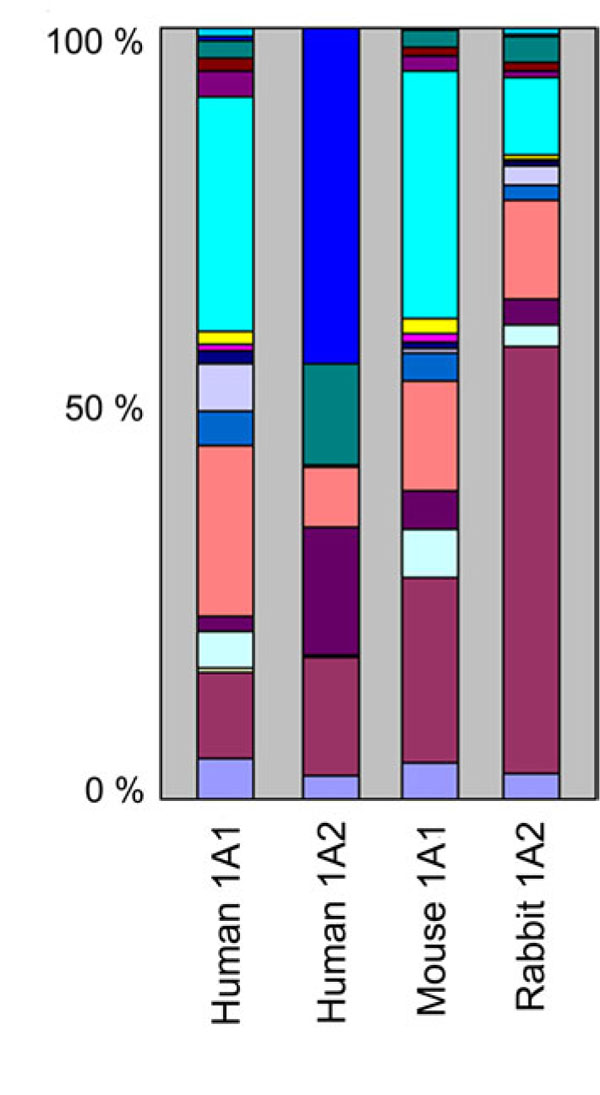
Fig. (1) Stacked bar plot representation of the activities measured
with steroid substrates. Each bar represents a CYP enzyme, and
each segment of a bar represents the contribution of one of the 16
steroid substrates to the total activity displayed by this enzyme.
Specific total activities are scaled to unit length. Colour encoding is
from the bottom to the top of each bar: medium purple, testosterone;
brown, RU486 N-demethylase activity; pale yellow, RU486
hydroxylase activities; light cyan, 17-methyltestosterone; dark red,
cortexolone; salmon, progesterone; blue, corticosterone; lavender,
pregnenolone; indigo, 17-hydroxyprogesterone; magenta, DHEA;
yellow, 21-hydroxyprogesterone; cyan, estrone; dark violet, nootkatone;
maroon, cortisol; seagreen, cis-androsterone; medium blue,
19-norandrostenedione; dark cyan, trans-androsterone.