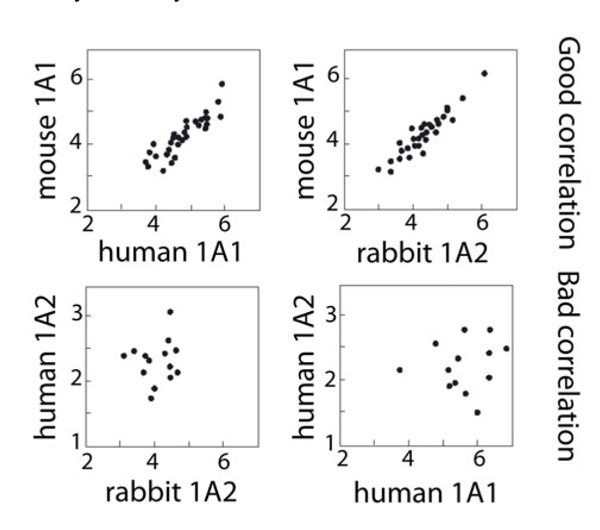
Fig. (2) Log-log comparison of steroid activities for the CYP1A
enzymes compared two-by-two. Activity units are in µV.s (MS
peak area) per min per mg microsomal protein and are expressed as
power of 10. Activities which were not detected for either one of
the two enzymes compared are not shown on the graph, being out
of the selected range.