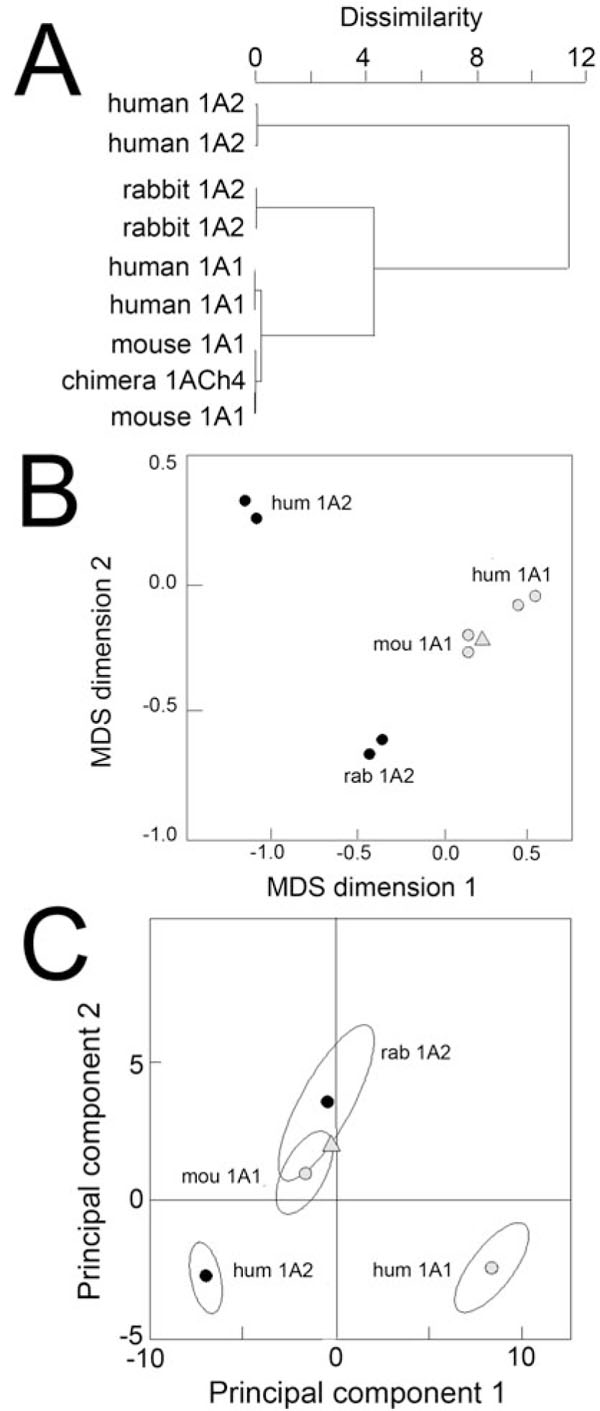
Fig. (3) Multivariate statistics on CYP1A kinetics with steroid
substrates. (A) Hierarchical classification performed on steroid
activities using the average linkage method and Ward's approach.
(B) MDS configuration of steroid activities using the absolute
MDS model (calculated Kruskal's stress = 0.063). (C) PCA for
steroid activities, the two first principal components retain 78.9 %
of initial variance in original data (PC1 retains 60.1 %). Solid circles
represent 1A2s; grey points, 1A1s; and grey triangles, 1ACh4
chimera which is mostly of mouse 1A1 sequence [Ref = 60]. The
PCA plot shows data means, and the helices represent data dispersion
for each CYP1A enzyme.