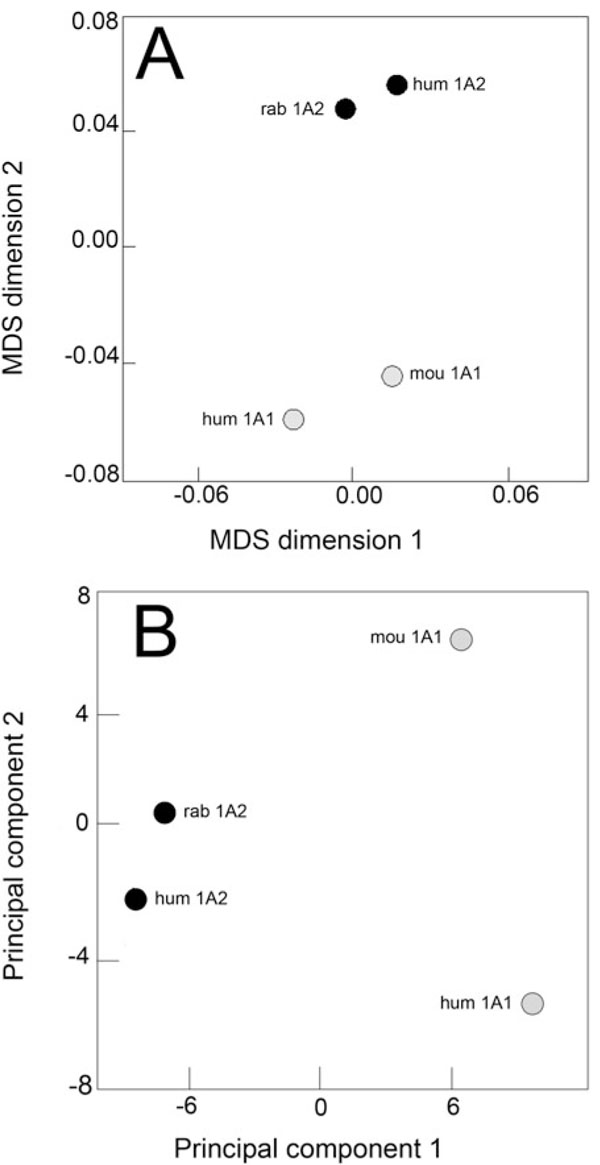
Fig. (5) CYP1A kinetic behaviours toward polycyclic aromatic
hydrocarbon substrates. (A). MDS configuration plot from a
dataset of 85 normalized specific activities monitored with 20 PAH
substrates (absolute MDS model, stress = 0.010). (B). PCA plot
with the first and second principal components (73% and 22% of
the dataset variance, respectively).