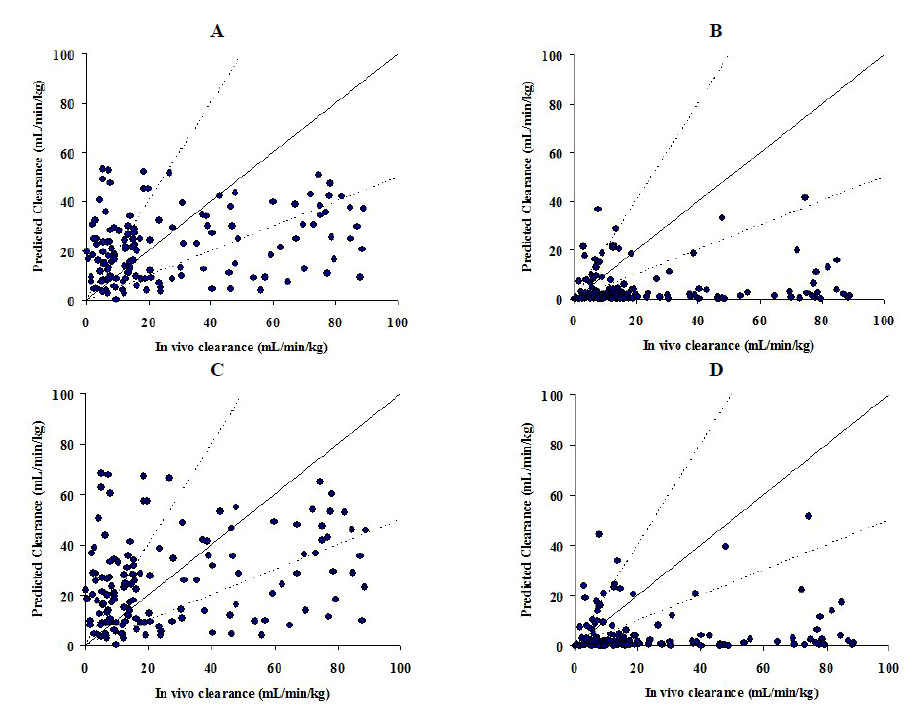
Fig. (1)
Plots between
in vivo
CL and predicted CL from mouse S9 (N = 146). A, Model A. B, Model B. C, Model E. D, Model F. Solid line represents lines of unity, and the area between the dot-lines represents an area within 2-fold error.