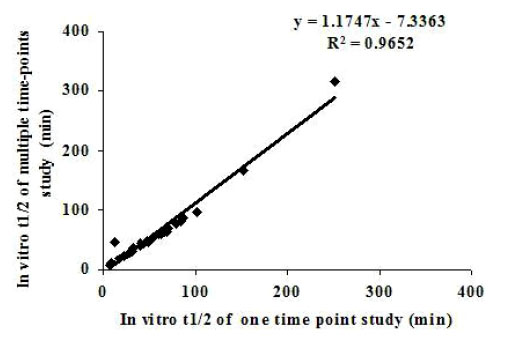
Fig. (3) Plots between in vitro t ½ of one time point study and in
vitro t ½ of multiple time-points study in metabolic stability assay
using 1 µM substrate concentration (N = 27). Solid line represent
the linear regression line with y = 1.1747 x - 7.3363 and R2 =
0.9652.