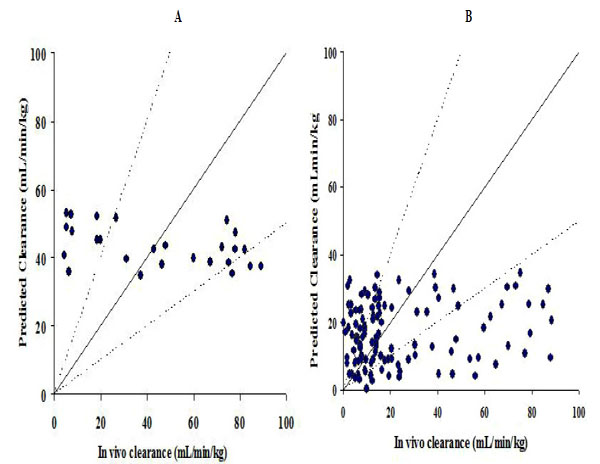
Fig. (4) Plots between in vivo CL and predicted CLin vitro from mouse S9 calculated from model A. A, compounds with moderate metabolic
stability (30%-70%). B, compounds with high metabolic stability (>70%). Solid line represents lines of unity, and the area between the dotlines
represents an area within 2-fold error.