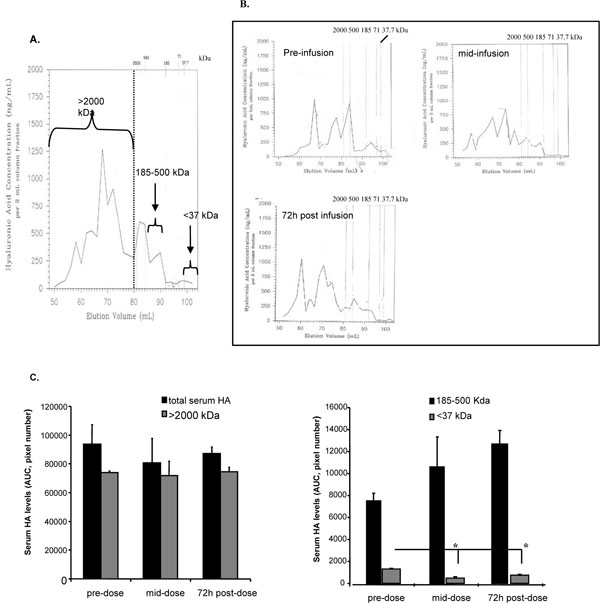
Fig. (6)
Molecular weight analysis of serum HA from period 4 (12 mg/kg).A. A typical molecular weight profile of serum HA, quantified by a modified anthrone assay following separation with gel filtration. High
molecular weight HA (<2000 kDa), 185-500 kDa HA, which corresponded to the infused exogenous HA, and small molecular weight HA
(<37 kDa) were quantified using image analysis to obtain pixel number in the area under the curve (AUC) as indicated in this sample profile.
B. The molecular weight profiles HA sampled from one volunteer is shown 2 h prior to infusion of HA (4th period, 12 mg/kg), mid-infusion
(at 1.5 h) and 72 h post-infusion. Equal amounts of CPC-precipitated HA were loaded onto the columns for each time period. C. The molecular
weight profiles of 4 volunteers were obtained as in (B) and AUC were calculated. Significant differences between the dosing times were
not detected for the high molecular weight or the 185-500 kDa fractions. However, the amount of small molecular weight HA (<37 kDa)
present in serum is significantly reduced following infusion of exogenous HA (p<0.01, Student’s t-test). Values represent the mean and
S.E.M. n=6.