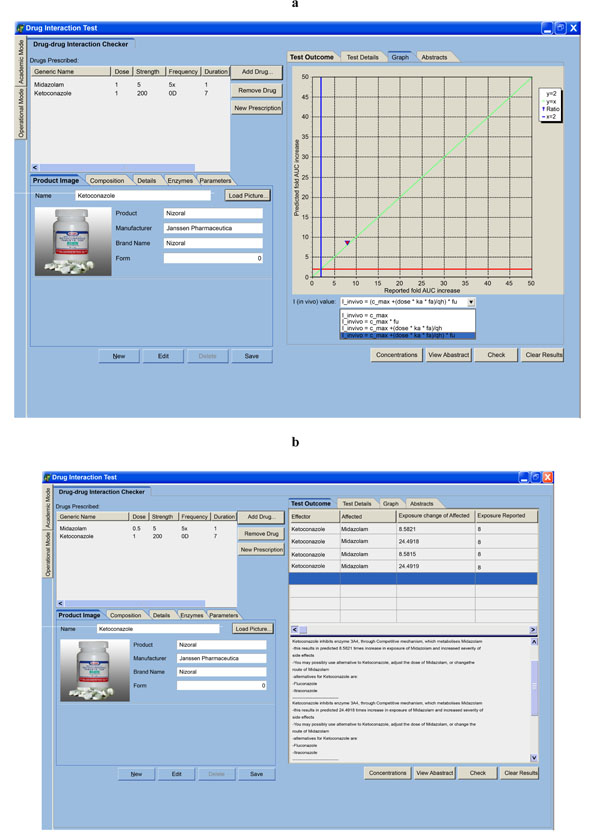
Fig. (4)
a)
. Illustration of how different inhibitor concentrations can be analyzed and their corresponding effect on the accuracy of prediction.
b)
. Different fold increase in exposure of affected drug due to different inhibitor concentrations.