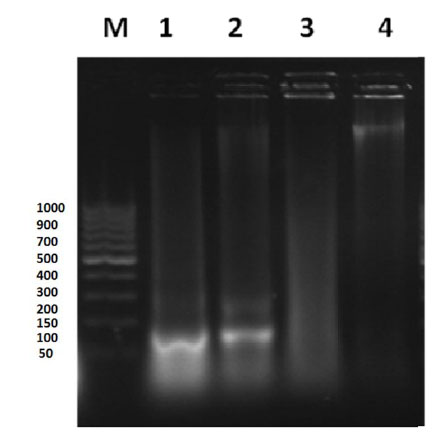
Fig. (4) Agarose gel electrophoretic pattern of DNA isolated from
liver tissue of control and treated mice. M: DNA ladder; Lane 1:
negative control group; Lane 2: positive control group; Lane 3:
diabetic mice group fed on basal diet; Lane 4: diabetic mice group
fed on walnuts mixture diet.