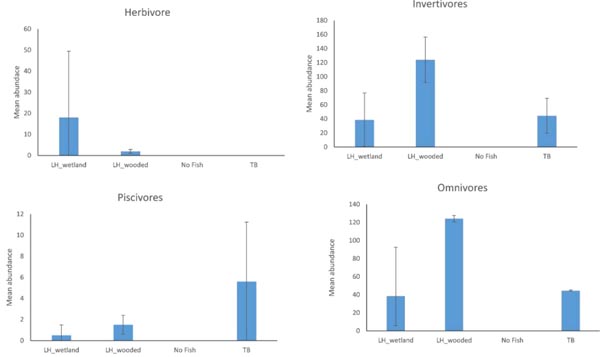
Fig. (5)
Mean abundances of functional groups within each distinct assemblage, a) herbivore, b) invertivore, c) omnivore, and d) piscivores. Error bars indicate 95% confidence intervals.