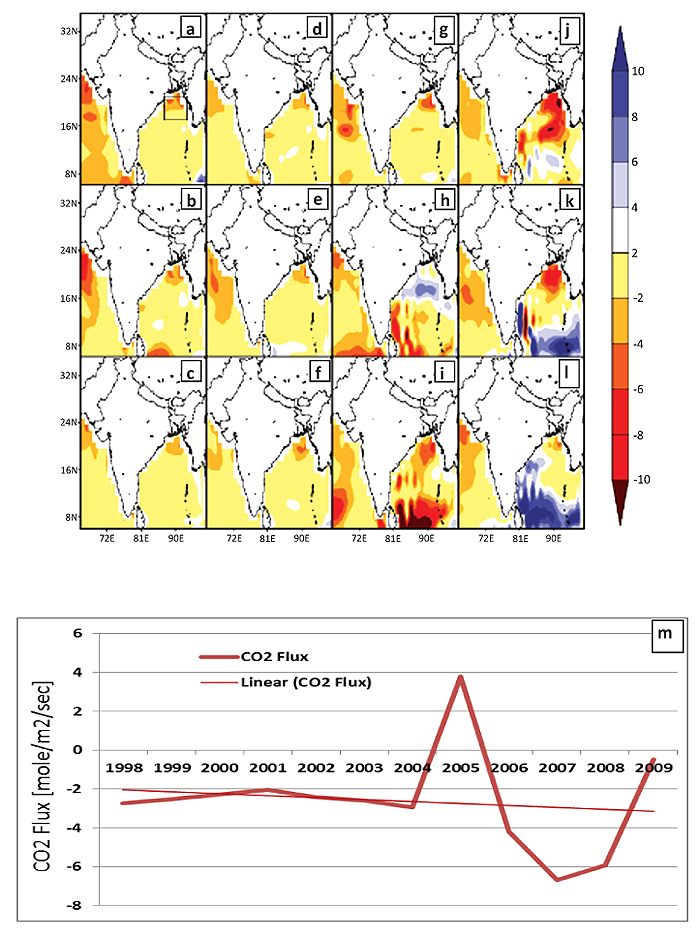
Fig. (2)
Optimized air-sea CO2 flux (mole/m2/sec) for the global ocean from APDRC. It is model output. Positive values of CO2 show downward flux while negative values upwards. (a to l) Spatial pattern of CO2 flux (*10-7 mole/m2/sec) for each year (m) CO2 flux (*10-7 mole/m2/sec), area averaged over the small box (shown in a) over Bay of Bengal.