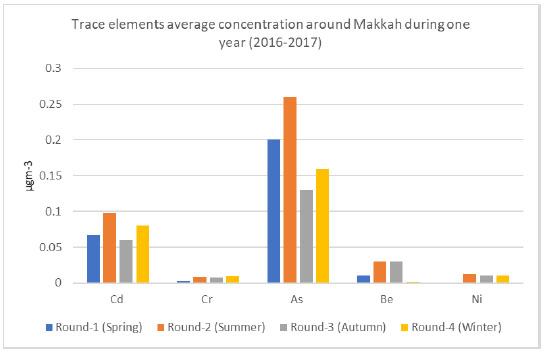
Fig. (3)
A bar graph showing average levels of trace elements around Makkah over a period of one year (2016-2017).