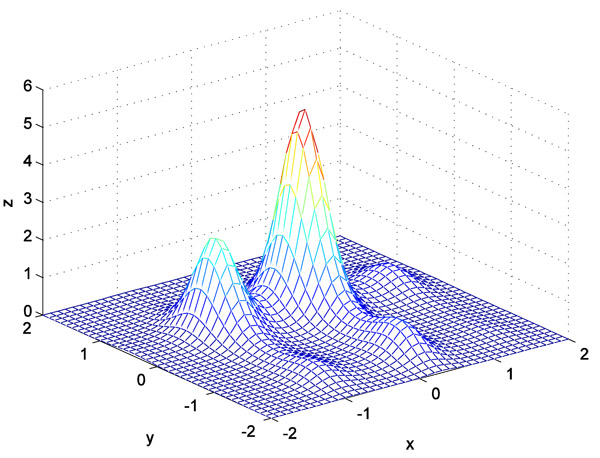
Fig. (3)
The second surface plot (
G
(x, y)).