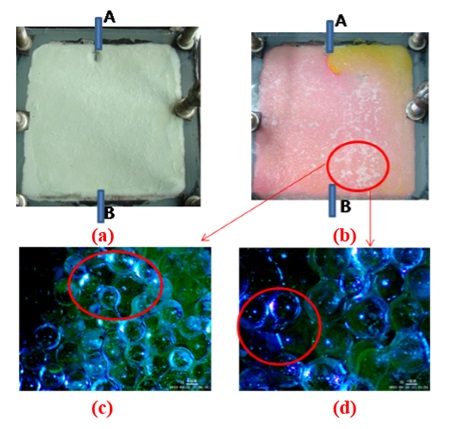
Fig. (1)
Fluid distribution after WAG injection in the flat plate model (
a
)initial model (
b
)after-flooding model, red for water phase and colourless for gas phase (
c
)local amplification of the model (
d
)local amplification of the model.