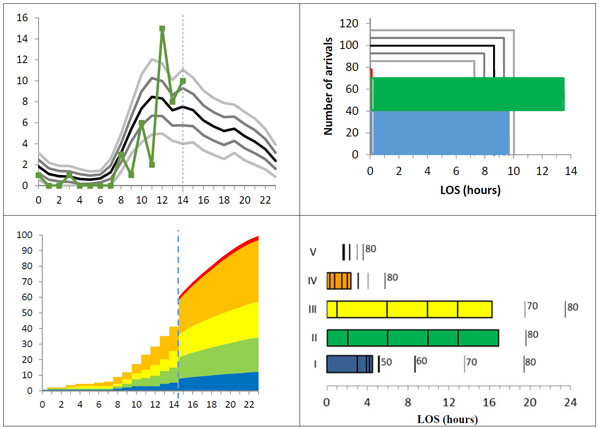
Fig. (4) Proposed visualizations of ED crowding: hourly arrivals for the current day (top left), length of stay and number of arrivals for completed patients, patients currently in the ED, and announced patients (top right), and the accumulated number of patients and their length of stay broken down on triage levels (bottom). The background curves show historical data from the studied ED; the data about the focal day are fictive.