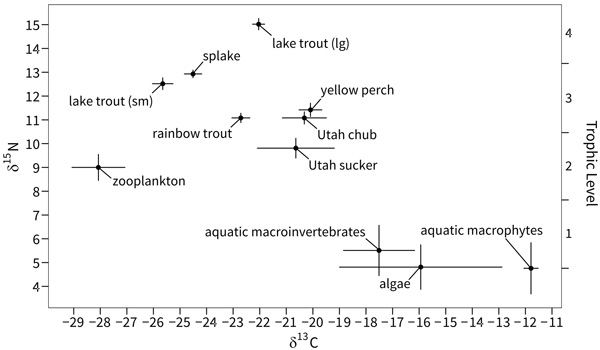
Fig. (1)
Bi-plot of average δ13C and δ15N signatures of fishes, plankton, aquatic macroinvertebrates, algae, and aquatic macrophytes in Fish Lake, Utah. Error bars represent 95% confidence intervals. Lake trout (lg) = lake trout over 700 mm. Lake trout (sm) = lake trout under 700 mm.