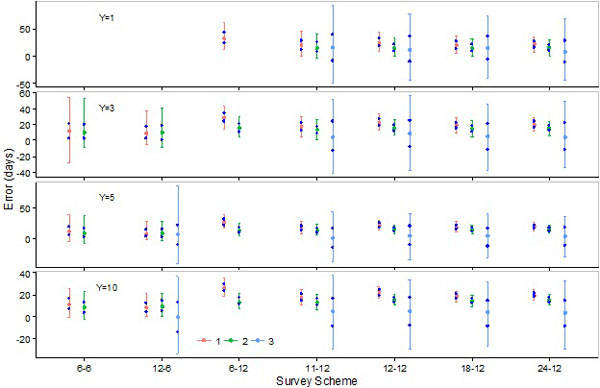
Fig. (3)
Errors in the estimation of the day (upper day) which is later than the peak day and on which abundance of soft shell crabs is 85% of the abundance on the peak day by the SCPUE model (1), the Hierarchical model (2), and the Generalized additive model (3). Five hundred data sets are obtained for each of the seven survey schemes with four different number of survey years. The red dot denotes the median over the five hundred estimates, and the two red bars and two blue dots indicate 5th and 95th percentiles and 25th and 75th percentiles, respectively.