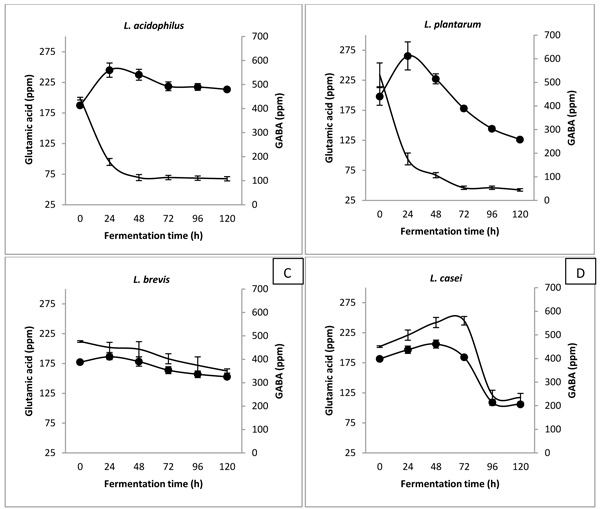
Fig. (2)
Glutamic acid metabolism (–)
vs
GABA (●) production by
L. acidophilus
(A)
,
L. plantarum
(B)
,
L. brevis
(C)
, and
L. casei
(D)
. The results are presented as the mean of triplicates with standard deviations.