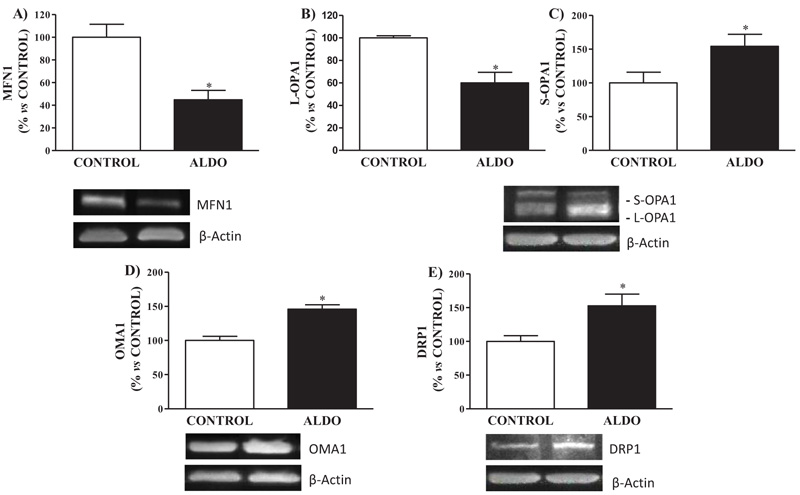
Fig. (5)
Effect of aldosterone on vascular mitochondrial morphology. Relative protein expression measured by Western Blot analysis of, A) Mitofusin 1 (MFN1), B) Optic atrophy type 1 long-isoform (L-OPA1) C) Optic atrophy type 1 short-isoform (S-OPA1), D) Dynamin-related protein 1 (DRP1) and E) Mitochondrial metalloendopetidase (OMA1). Data are expressed as percentage of mean ± SEM versus CONTROL group. * p < 0.05 vs. CONTROL. CONTROL: Control group; ALDO: Aldosterone-salt group; (n=20).