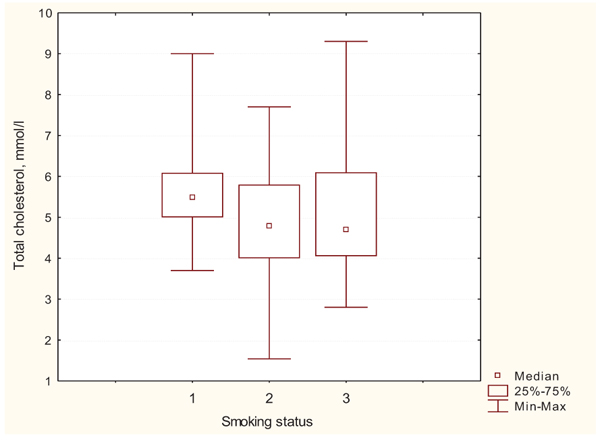
Fig. (1)
Intergroup differences by TCH levels; 1 – smokers; 2 – non-smokers; 3 – past-smokers.