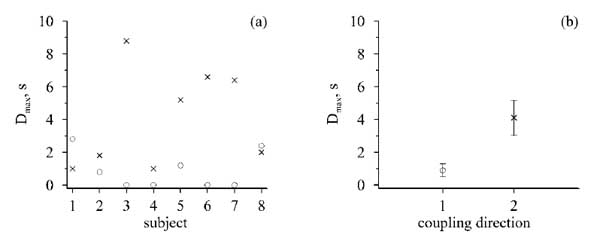
Fig. (2)
(a) Estimations of delay times for each of the eight subjects. (b) Delay times averaged over the subjects (mean ± standard error of the means). Delay times in coupling from regulatory loop of HRV to regulatory loop of PPGV are shown by circles and delay times in coupling from PPGV to HRV are shown by crosses.