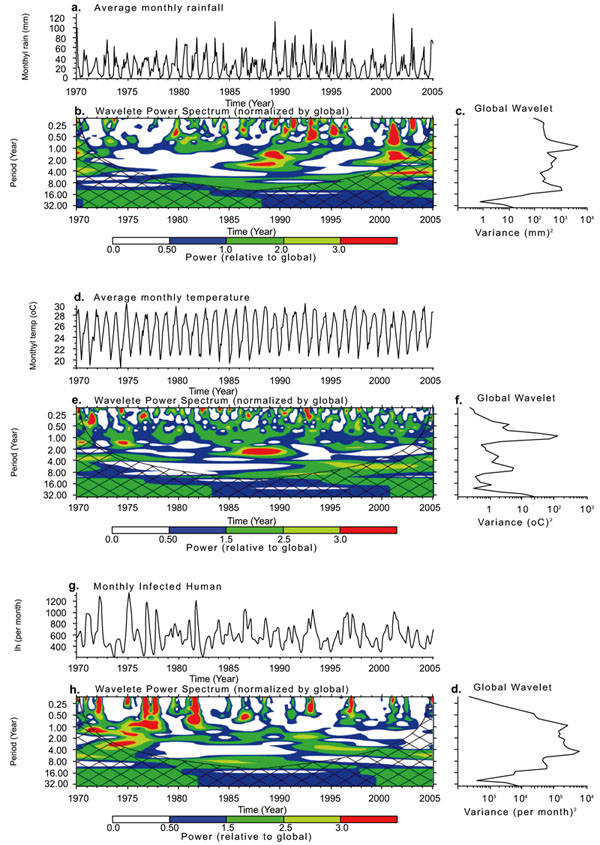
Fig. (5)
The wavelet analysis of the climate variables of KwaZulu-Natal province from 1970-2005}. The time series of average monthly (a) rainfall, (d) temperature and (g) simulated infected humans. The wavelet power spectrum of (b) rainfall, (e) temperature and (h) Infected humans time series. The cross-hatched region is the cone of influence, where zero padding has reduced the variance and only pattern above the region are considered reliable. The colour code values from blue (low values) to red (high values). The global wavelet power spectrum of (c) rainfall, (f) temperature and (i) Infected humans have been scaled. The black contour line corresponds to 10% significance level, using the global wavelet as the background spectrum.