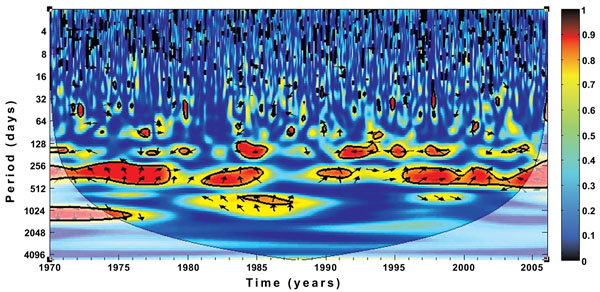
Fig. (8)
Wavelet coherence of temperature and simulated infected human over KwaZulu-Natal from 1970-2005. The arrows indicate the relative phasing of the variables, while the faded regions represent the cone of influence and are not considered for the analyses.