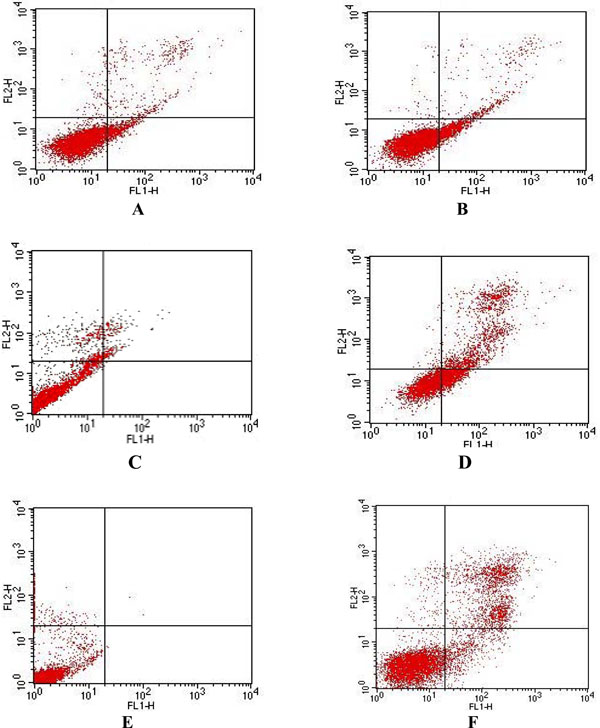
Fig. (6) Flow cytometric analysis of untreated control U937 (A), K562 (C), HL-60 (E) cells and with LCLE (150 μg/ml) treated U937 (B),
K562 (D), HL-60 (F) cells respectively stained with annexin V FITC and propidium iodide. Dual parameter dot plot of FITC-fluorescence
(x-axis) vs PI-fluorescence (y-axis) shows logarithmic intensity.