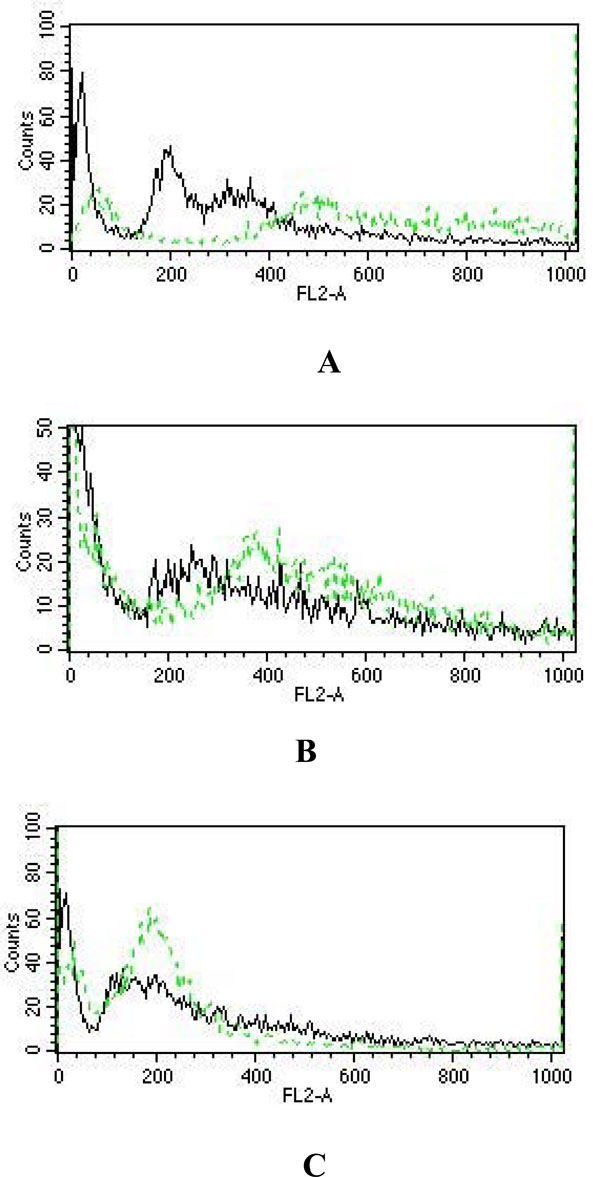
Fig. (7) Flow cytometric analysis of untreated control (black
waves) and treated (green waves) cells. (A) overlay representation
of untreated control and LCLE (150 µg/ml) treated U937 cells, (B)
overlay representation of untreated control and LCLE (150 µg/ml)
treated K562 cells and (C) overlay representation of untreated control
and LCLE (150 µg/ml) treated HL-60 cells. Histograms represent
various contents of DNA with actual number of cells (x-axis
denotes fluorescence intensity of propidium iodide and y-axis denotes
count).